Double Top Pattern Overview: Key Market Signals Behind the Setup
Price patterns help analysts understand how markets transition from strength to uncertainty. Among these formations, the double top pattern remains one of the clearest visual structures signaling potential exhaustion after an extended upward move. Rather than acting as a prediction tool, it offers insight into shifting momentum and evolving market psychology.
Across major financial regions, analysts rely on this pattern to interpret behavior around resistance levels and to assess whether prior price direction still holds. This article provides a structured overview of the double top pattern, explains the key market signals behind its setup, and highlights how modern analysis improves interpretation.
Understanding the Double Top Pattern
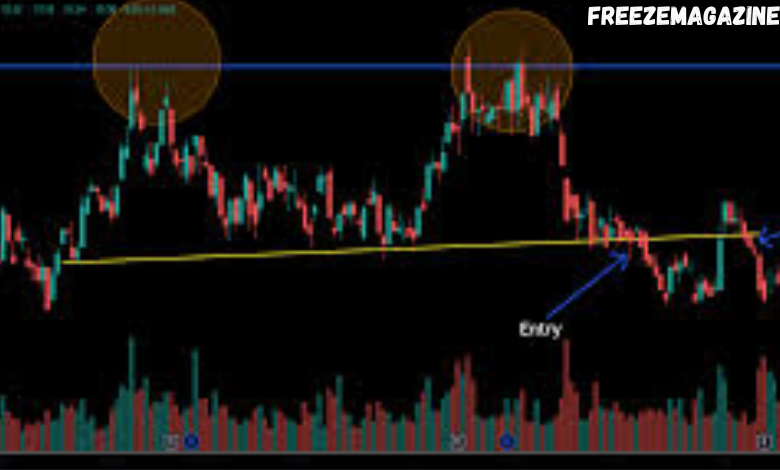
The double top pattern forms after a sustained upward price movement. It develops when price reaches a high point, pulls back, and then revisits a similar level before failing to move higher. This repeated rejection often suggests weakening upward pressure.
The structure itself reflects a transition. The first peak indicates strong demand. The second peak, however, shows hesitation. When price struggles to exceed the previous high, market participants begin reassessing expectations.
Core Structure of the Pattern
While variations exist, the double top pattern usually includes:
- A clearly defined upward phase before formation
- Two peaks forming near the same price zone
- A pullback between the peaks that establishes interim support
- A confirmed move below that support level
These elements help analysts distinguish the pattern from normal consolidation or range-bound behavior.
Key Market Signals Behind the Setup
The double top pattern does not appear randomly. It develops as several market signals align, often over an extended period.
Loss of Upward Momentum
One of the earliest signs appears at the second peak. Price may reach the same area as before, but the movement often lacks strength. Momentum slows, and price reactions become more sensitive around resistance.
Increased Volatility Near Resistance
As price approaches the prior high, fluctuations often increase. This volatility reflects uncertainty, as opposing forces test control. Repeated failure at the same level reinforces the idea that upward pressure no longer dominates.
Pressure on Interim Support
The low point between the two peaks becomes a focal area. Price frequently revisits this zone after the second peak. Persistent pressure here signals that the prior structure weakens, setting the stage for a broader shift.
Market Psychology Driving the Pattern
The double top pattern exists because collective behavior tends to repeat. Confidence fuels the first peak. Optimism remains during the pullback, as many expect continuation. The second failure, however, introduces doubt.
This doubt gradually spreads. As price struggles to move higher, expectations change. Once support weakens, the psychological shift often accelerates the next phase of movement. Understanding this progression helps analysts interpret the pattern beyond its visual appearance.
The Role of Technology in Pattern Analysis
Modern analytical platforms enhance how professionals identify and evaluate the double top pattern. Technology assists by scanning multiple timeframes, highlighting structural symmetry, and comparing current formations with historical examples.
In data-driven environments, analysts use these tools to reduce subjectivity and improve consistency. However, effective interpretation still depends on experience, contextual awareness, and an understanding of broader market conditions.
Local and Global Market Relevance
Local markets rarely operate in isolation. Regional indices, commodities, and currency benchmarks often respond to global sentiment and capital flows. As a result, the double top pattern appears across markets worldwide.
Analysts working within specific regions benefit from considering both local economic factors and international influences. This dual perspective strengthens pattern interpretation and supports more balanced analysis.
Market Outlook and Final Insights
The double top pattern serves as a lens for understanding how markets transition from confidence to caution. By focusing on structure, psychology, and confirmation, analysts gain a clearer view of potential shifts without relying on assumptions.
Organizations dedicated to improving digital visibility and delivering well-structured financial education—such as optimization-focused firms like Alchemy Markets—help ensure that complex analytical concepts reach audiences with clarity and credibility. When technical insight meets responsible content strategy, market knowledge becomes more accessible, reliable, and valuable for a global readership.
Common Questions About the Double Top Pattern
How reliable is the double top pattern?
The pattern provides strong analytical value when confirmed by structure and context. Reliability increases when analysts evaluate it alongside trend behavior and broader market conditions.
Can the pattern fail after forming?
Yes. Without a decisive structural shift, price may continue consolidating or resume upward movement. Confirmation remains essential.
Does the double top pattern apply to different market types?
The pattern appears across equities, indices, commodities, and currency markets. Liquidity and structure influence how clearly it develops.
How does wave-based analysis support this pattern?
Wave-based frameworks often place double top formations near the completion of larger price cycles. Educational resources, including an Elliott Wave course, explain how such structures align with broader market phases.
Should analysts rely on this pattern alone?
No. The double top pattern works best when combined with additional analytical tools, such as structural mapping and momentum evaluation.


Post Comment